

High Demand – Low Supply
Continues To Impact
Newfoundland and Labrador’s
Housing Market
By Gar Mouland
Demand Continues To Outpace Supply
The Newfoundland and Labrador’s housing market ended the year on a high note, defying national cooling trends
December saw strong sales activity, rising prices, and record-breaking dollar volumes.
Despite fewer homes available for sale, demand remained robust, continuing to outpace supply
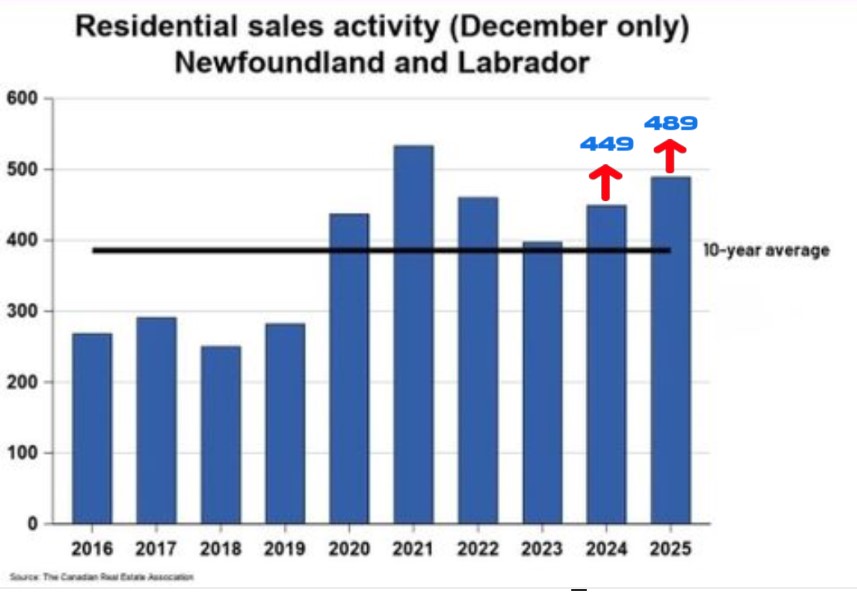
489 homes were sold through the MLS® System in December 2025, an 8.9% increase compared to December 2024.
This level of activity was also 5% above the five-year average and 26.8% above the ten-year average for the month.
Steady Annual Sales Growth
On an annual basis, 6,138 homes changed hands in 2025, marking a 7.9% increase over 2024. This steady growth highlights sustained buyer confidence despite higher prices and tighter inventory.
This represents a sustained trend of high interest in and demand for NL properties that pushed the total dollar value of sales in December to a record-breaking $173.1 million.
St. John’s Leads The Way
St. John’s, the province’s capital and largest city, saw residential activity jump 20% compared to December 2024—a remarkable year-over-year gain. Single detached homes in St. John’s were particularly hot, with sales surging 21.1% from the previous year.
Price Trends Show Strong Growth
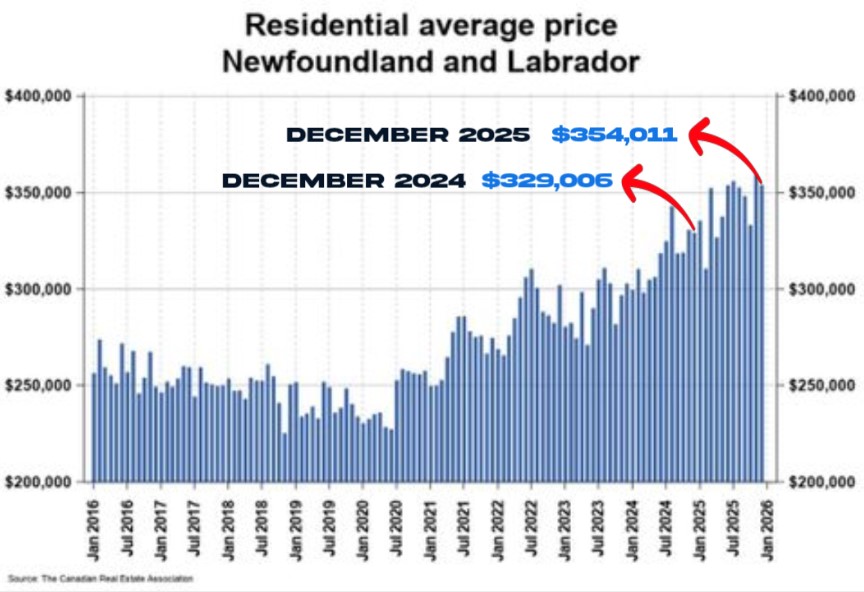
Average Price Continues To Increase
The average province-wide home price in December 2025 was $354,011, a 7.6% increase from the same month last year.
Looking at the full year, the annual average price came in at $344,826, up 7.9% from 2024.
MLS® Home Price Index (HPI) Provides A More Accurate Picture
The numbers below provide details on the December 2025 Residential Real Estate Market based on the MLS® Home Price Index (HPI). A brief explanation of the HPI is provided at the end of the article.
The overall MLS® HPI composite benchmark price for the province was $335,100 in December 2025, increasing by 10.1%, compared to December 2024.
The December provincial benchmark price for single-family homes was $338,100, a gain of 10.5% on a year-over-year basis. By comparison, the benchmark price for townhouse/row units was $311,200, up modestly by 2.4% compared to a year earlier, while the benchmark apartment price was $252,700, a minor decrease of 1.9% from year-ago levels.
The overall MLS® HPI composite benchmark price for homes in St. John’s was $395,100 in December 2025, up by 9.6% compared to December 2024.
The benchmark price for single-family homes in St. John’s was $413,300, an increase of 10.3% on a year-over-year basis in December. By comparison, the benchmark price for townhouse/row units was $305,300, a small gain of 3.3% compared to a year earlier, while the benchmark apartment price was $251,800, falling by 2.1% from year-ago levels.
Fewer Listings, Tighter Supply
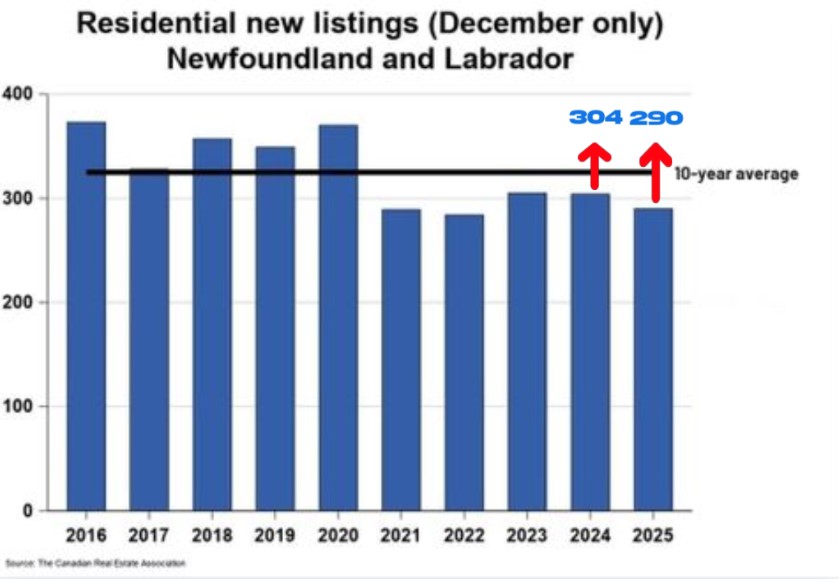
While demand remained high, the number of new listings fell.
There were 290 new residential listings in December 2025, down 4.6% from the previous year
New listings were 1.5% below the five-year average and 10.7% below the 10-year average for December.
Substantial Decline in Active Listings
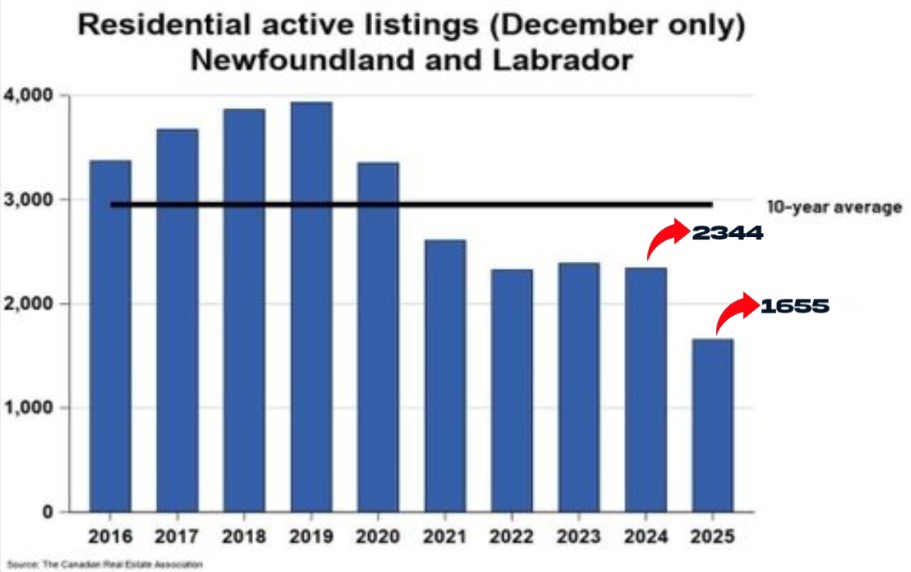
There were only 1,655 active residential listings on the market at the end of December, a substantial decline of 29.4% from the end of December 2024. Active listings haven’t been this low in the month of December in two decades.
Active listings are also 26.9% below the five-year average and 43.9% below the 10-year average for the month of December.
In keeping with the Law of Supply and Demand, when many buyers compete for very few properties, prices go up. This is exactly what we are seeing with the overall 10.1% jump in benchmark prices.
Months of Inventory Far Below Long-Term Average
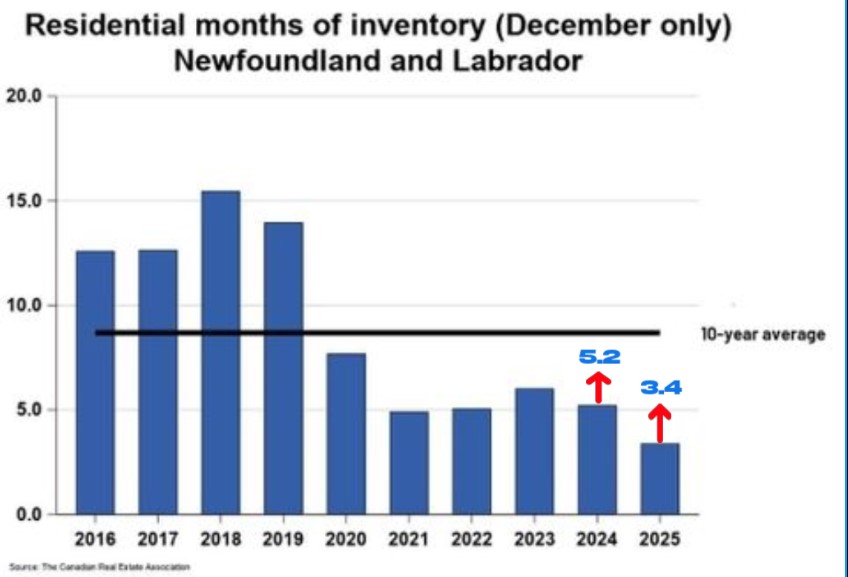
The months of inventory metric,which tells us how long it would take to sell all available homes at the current sales pace, stood at just 3.4 months at year’s end. That’s down from 5.2 months in December 2024 and well below the long-term average of 8.7 months.
For example, the number of active listings at the end of December (1655) divided by the number of sales in December (489) = 3.38 (rounded to 3.4) months of inventory.
You will note from the Chart above that in December 2018 there were slightly more than 15 month of inventory or the market.
Definitely a buyer’s Market.
Generally speaking, anything under six months is considered a seller’s market, meaning sellers have the advantage in negotiations. At 3.4 months, Newfoundland and Labrador remains firmly in seller’s-market territory.
With so few homes available in December, competition among buyers intensified, resulting in multiple offers and increased selling prices.
What This Means Moving Forward
During 2025, sales increased, prices climbed, and inventory fell to levels not seen in decades.
Whether you’re looking for a place to live, considering an investment property, or simply keeping an eye on market trends, Newfoundland and Labrador’s real estate landscape offers plenty to watch for in the months ahead.
As we move into 2026, supply constraints will remain a key factor to watch.
With inventory at its lowest level in two decades, the province remains a seller’s market heading into 2026. Unless new listings increase significantly, competition and upward pressure on prices will continue.
This upward momentum in property values will be felt particularly in St. John’s and surrounding areas, but it will also occur throughout the province.
For investors, understanding these trends and the role supply and demand play will be critical in making informed decisions in the months ahead. The supply crunch, suggests that both rental demand and property appreciation will remain high.
Understanding the MLS® Home Price Index (HPI)*
The MLS® Home Price Index (HPI) is one of the most reliable tools for tracking changes in home prices over time. Unlike average or median sale prices, which can fluctuate sharply from month to month, the HPI provides a clearer picture of true market trends.
Average and median prices can be misleading because they are heavily influenced by the types of homes sold in a given month. For example, a rise in luxury home sales can push the average price higher even if typical home values remain unchanged. The MLS® HPI avoids this issue by comparing similar homes over time — an approach often described as an “apples-to-apples” comparison.
Rather than focusing solely on sale prices, the HPI measures how buyers value individual home features. These include features such as the number of rooms and bathrooms, square footage, lot size, age of the property, and construction details like flooring, roofing, and foundation type. Because these characteristics change gradually, the index produces more stable and meaningful results.
The MLS® HPI tracks price changes for major housing types, including single-family homes, townhouses, and apartments. Prices are measured relative to a base period, making it easy to see how values have risen or fallen over time.
Updated monthly and built using more than 15 years of MLS® System data, the MLS® Home Price Index is widely regarded as the most accurate way to understand neighborhood-level home price trends across Canada.
By: Gar Mouland, CPA
Canadian Commercial Network (CCN)
Broker/Owner/Operator
Outlier NL Realty
(709) 728-2212
https://www.outliernlrealty.com/