
Whether you’re looking for a home for you and your family or strictly as an investment, understanding the market is crucial for making informed decisions, In this regard, the September 2025 Report for the NL housing market offers some compelling insights into the current market. Key takeaways from the report include an increase in home sales, continued upward trend in prices and historically low inventories. To obtain an invaluable insight into the current market, take a look at the full market analysis below.
Strong Sales Activity Province-Wide
A total of 610 homes were sold in Newfoundland and Labrador in September 2025, according to the MLS® System of the Newfoundland and Labrador Association of REALTORS®. That’s a 19.8% increase from September 2024. (see graph below)
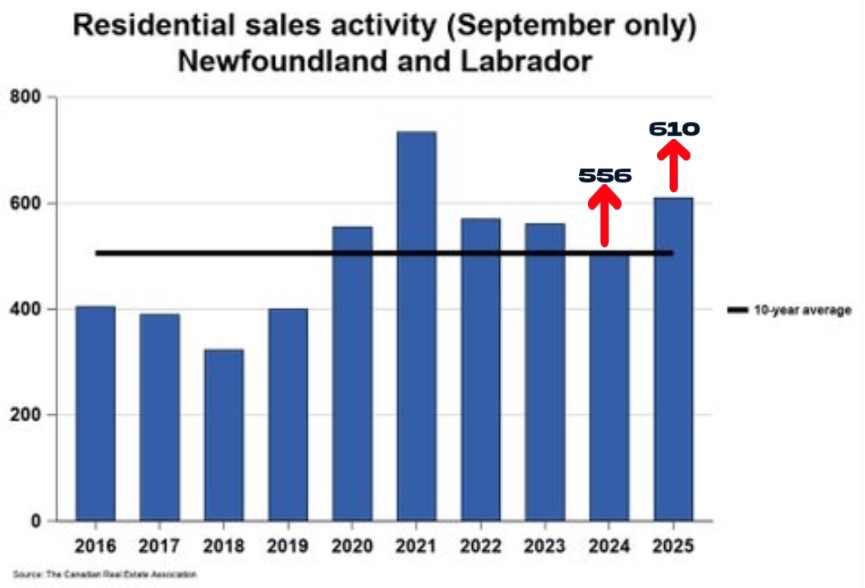
What you will note from the bar graph is that sales weren’t just up compared to last year – they exceeded historical trends as well. September sales came in 2.2% above the five-year average and a remarkable 20.6% above the 10-year average.
Looking at the bigger picture, the first nine months of 2025 saw 4,380 homes change hands, up 10.2% from the same period in 2024. That’s thousands of families finding new homes and significant economic activity flowing through the province.
Regional Performance Highlights
St. John’s led the charge with an impressive 21% year-over-year increase in residential activity. The capital city’s single detached homes were particularly hot, posting a 25.9% gain compared to September 2024. Meanwhile, the rest of the province wasn’t far behind, with activity up 19.4% across other regions.
This broad-based growth suggests the market’s strength isn’t confined to one area. Opportunities and demand exist throughout Newfoundland and Labrador.

St. John’s Harbor and Surrounding Area
Understanding Home Prices: What’s the MLS® HPI?
Before diving into price trends, its important for you to understand the MLS® Home Price Index (HPI).
Unlike simple averages (which can be skewed by a few very expensive or very cheap sales), the HPI tracks the value of a typical “benchmark” property over time. It’s similar to tracking the price of the same basket of goods at the grocery store – you’re comparing apples to apples. This makes the HPI far more reliable for understanding true price trends and market conditions.
Real estate professionals and economists trust it because it filters out the noise and shows genuine price movements.
Price Trends Show Solid Appreciation
September’s HPI numbers reveal significant price growth across all property types. The overall composite benchmark price reached $337,500, up 10.3% from September 2024.
Breaking it down by property type:
- Single-family homes hit a benchmark of $340,300 (up 10.4%)
- Townhouses and row units reached $318,800 (up 4.7%)
- Apartments stood at $259,000 (up 5.1%)
St. John’s prices climbed even higher, with the overall composite benchmark reaching $402,100 – a 10.4% annual increase. Single-family homes in the capital were at $420,200, with townhouses at $312,900, and apartments at $259,300.
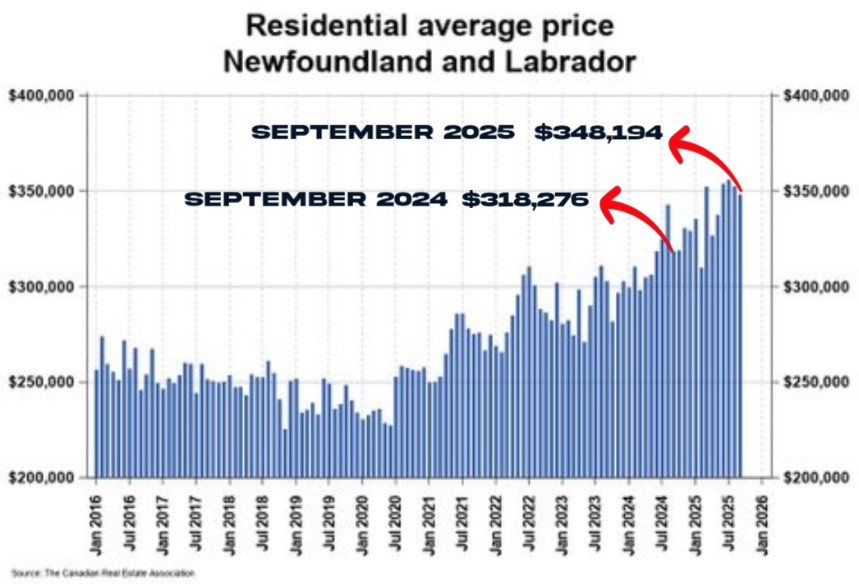
The average sale price across all properties was $348,194 in September, up 9.4% year-over-year. For the year to date, the average sits at $343,780, representing an 8.4% gain from 2024. (see graph below)
.
Increase in Listings
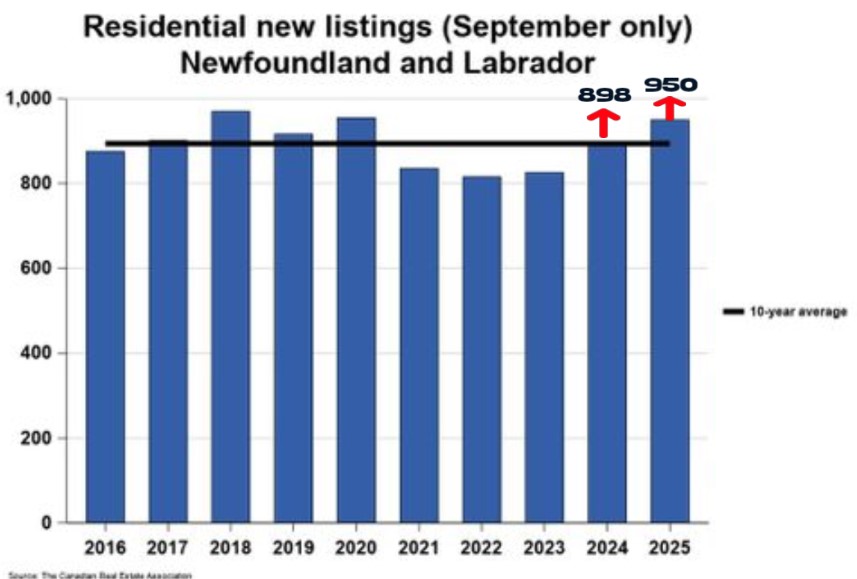
The number of new listings was up 5.8% from September 2024, with 950 new residential listings added during the month. This was the highest number of new listings in September in five years, and it was also above both the five-year and 10-year averages. This indicates some positive movement from sellers entering the market. (see graph below)
Sharp Decrease in Total Active Listings
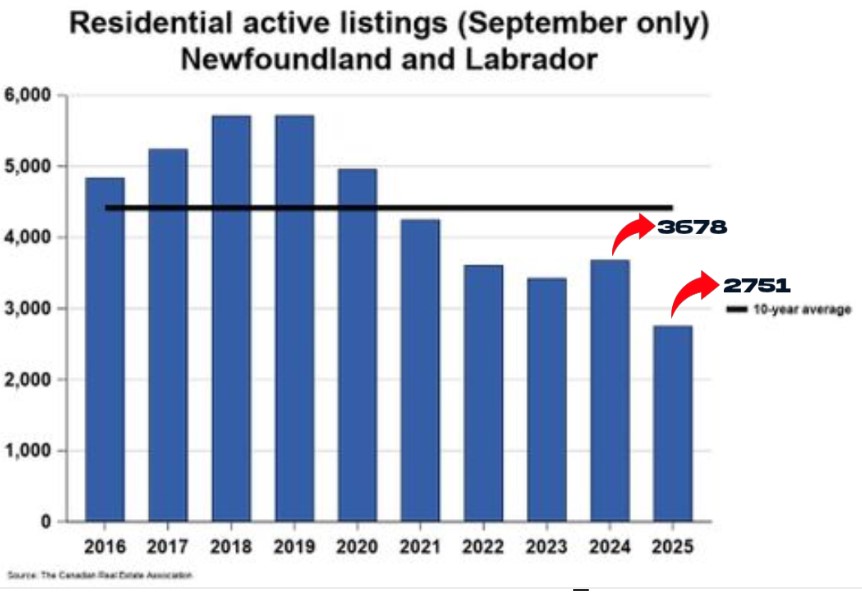
However, despite the increase in new listings, active residential listings (homes available for sale) numbered only 2,751 units at the end of September. This represents a sharp 25.2% decrease from September 2024, marking the lowest September inventory in over 15 years. Active listings are also significantly below both the five-year (-22.3%) and 10-year (-37.7%) averages for the month. (see graph below)
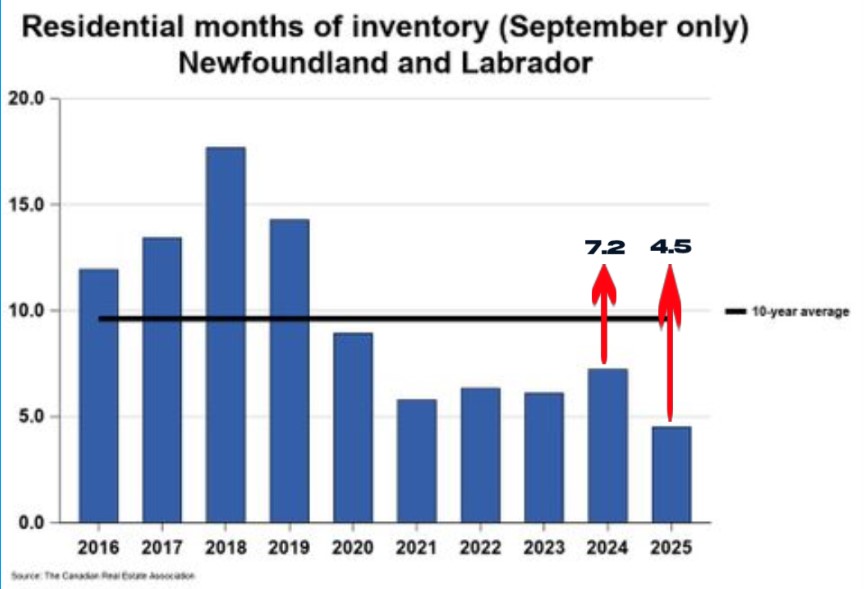
Months of Inventory
A key metric for understanding market balance is “months of inventory” – essentially, how long it would take to sell all available homes at the current sales pace. September ended with just 4.5 months of inventory, down from 7.2 months a year earlier and well below the long-term average of 9.6 months. (see graph below)
Record-Breaking Market Value
Here’s a number that really captures the market’s momentum! The total dollar value of all September home sales reached $212.4 million. This represents a substantial 31.1% increase from September 2024 and sets a new record for the month.
The Bottom Line
Newfoundland and Labrador’s real estate market closed out September 2025 on a high note. Strong sales, rising prices, and tight inventory paint a picture of a competitive market with healthy demand. For sellers, conditions are favorable. For buyers, expect competition but know you’re investing in a market showing genuine strength.
Whether you’re looking to buy or sell, understanding these trends will help you make informed decisions.
Data sourced from the Newfoundland and Labrador Association of REALTORS® MLS® System for September 2025.

Gar Mouland, CPA
Canadian Commercial Network of Realtors, CNN
Broker/Owner/Operator
Outlier NL Realty
709 728 2212
https://www.outliernlrealty.com/
Hello! I sent a request, but have not yet received a response. Perhaps my message did not go through. I would be very grateful if you could contact me via WhatsApp.
wa.me/+37281672599
Warm greetings! Hope you’re doing well.
I believe in direct help. That’s why I provide financial grants for projects, education, and personal circumstances. Contact me on WhatsApp +66927317932