
Softening Home Sales in February
Active Listings Continue Falling.

NL Home Sales Down to Start 2026
February 2026 home sales were 10.6% below the past five-year average and 6.1% above the past 10-year average for the month of February.
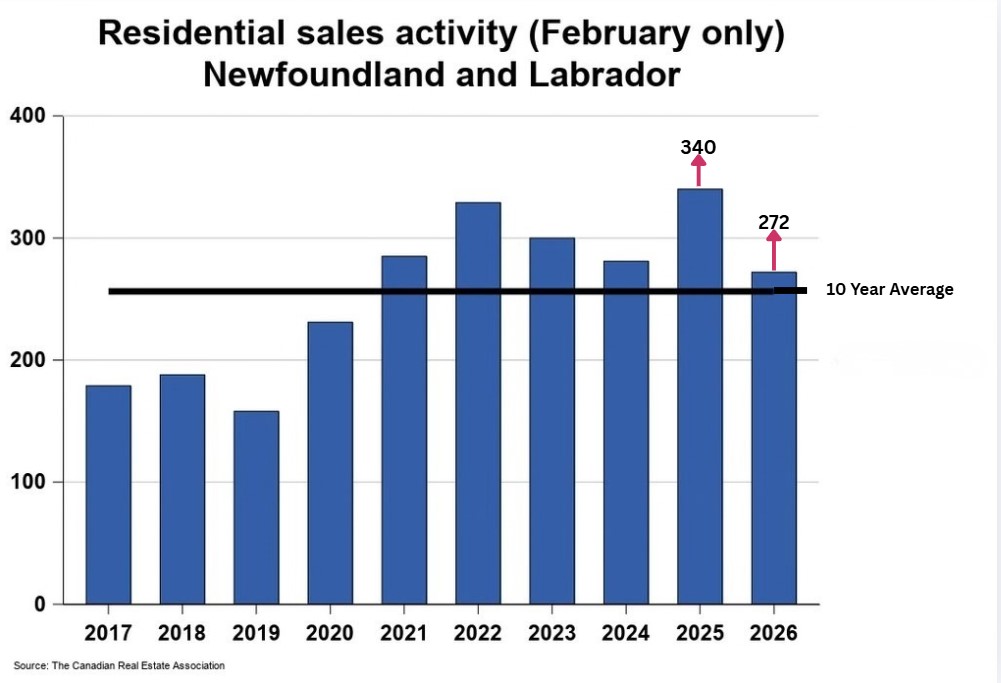
The number of homes sold through the MLS® System of the Newfoundland and Labrador Association of REALTORS® totaled 272 units in February 2026, a decline of 20% from February 2025.
Residential activity in St. John’s was down significantly by 44.6% on a year-over-year basis in February, while activity in the rest of the province posted a moderate decrease of 6.4%.
Single detached home sales in St. John’s posted a huge decline of 59.3% from levels recorded in February 2025.
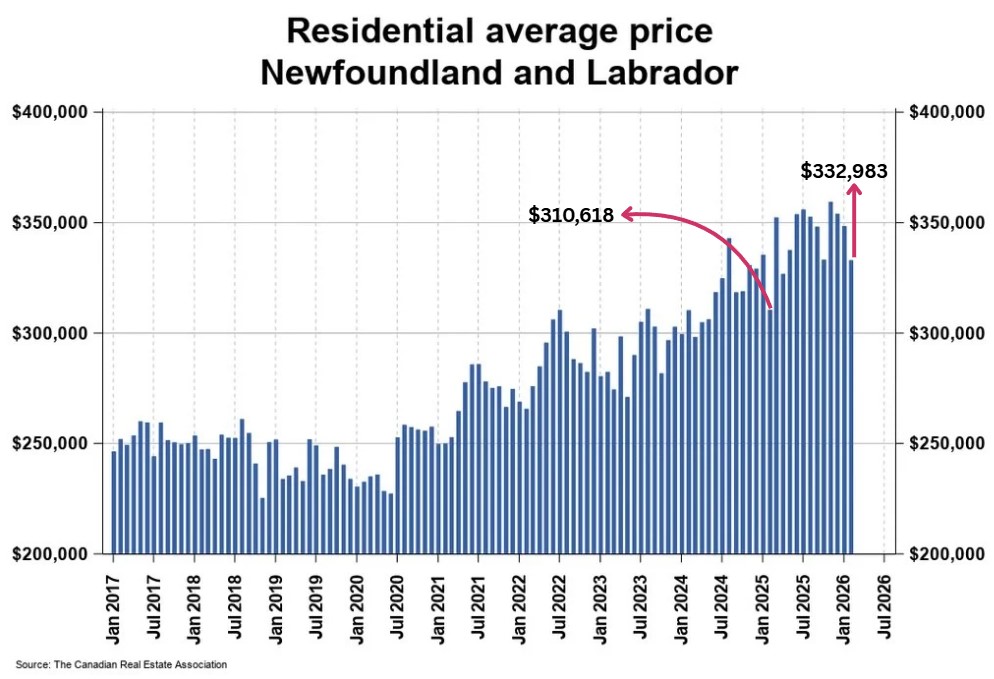
The province-wide average+ price of homes sold in February 2026 was $332,983 a moderate gain of 7.2% from February 2025.
However, compared to the previous month’s average selling price of $348,366, February’s average selling price was down by 4.4%
+Please note that when comparing average home selling prices, especially from month-to-month, the averages are highly sensitive to outliers.
As a result, given that relatively few residential properties sell in this province during a given month, a few exceptionally high or low priced properties selling in a particular month can significantly skew the average.
The MLS® Home Price Index (HPI)* tracks price trends far more accurately than is possible using average or median price measures. (Refer to the brief explanation of the HPI at the end of the post)
The overall MLS® HPI composite benchmark price was $328,100 in February 2026, a gain of 7.7% compared to February 2025. (It was $334,000 in January 2026)
The benchmark price for single-family homes was $330,800 in February 2026 an increase of 8% on a year-over-year basis.
By comparison, the benchmark price for townhouse/row units was $311,900, a small gain of 3.7% compared to a year earlier, while the benchmark apartment price was $251,700, a small reduction of 1.9%% from year-ago levels.
The overall MLS® HPI composite benchmark price for homes in St. John’s was $389,200 in February 2026, an increase of 6.5 % compared to February 2025.
The benchmark price for single-family homes in St. John’s was $406,900, up by 7% on a year-over-year basis in February.
By comparison, the benchmark price for townhouse/row units was $306,700 a moderate gain of 5.2% compared to a year earlier, while the benchmark apartment price was $250,500, falling by 2% from year-ago level
New Listings were 15.3% below the five-year average and 25.4% below the 10-year average for the month of February.
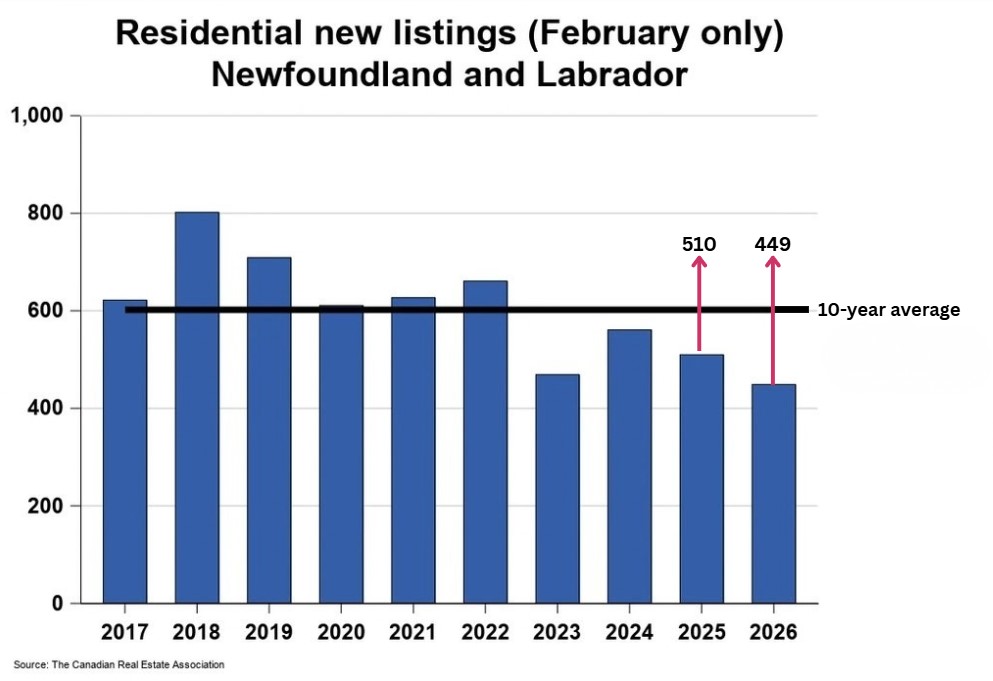
There were 449 new residential listings in February 2026. This was down by 12% from February 2025. It was also the lowest number of new listings added in the month of February in more than 15 years.
Active listings were 28.4% below the five-year average and 47.1% below the 10-year average for the month of February.
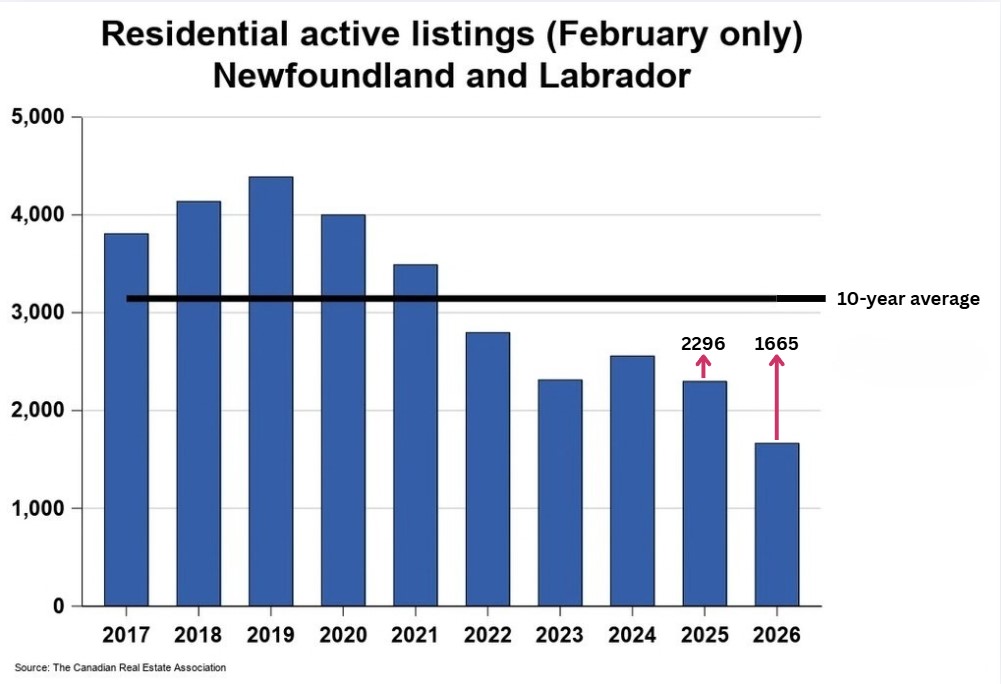
Active residential listings numbered 1,665 units on the market at the end of February, a substantial decline of 27.5% from the end of February 2025.
The 6.1 months of inventor at the end of February was well below the long-run average of 13.9 months for this time of year.
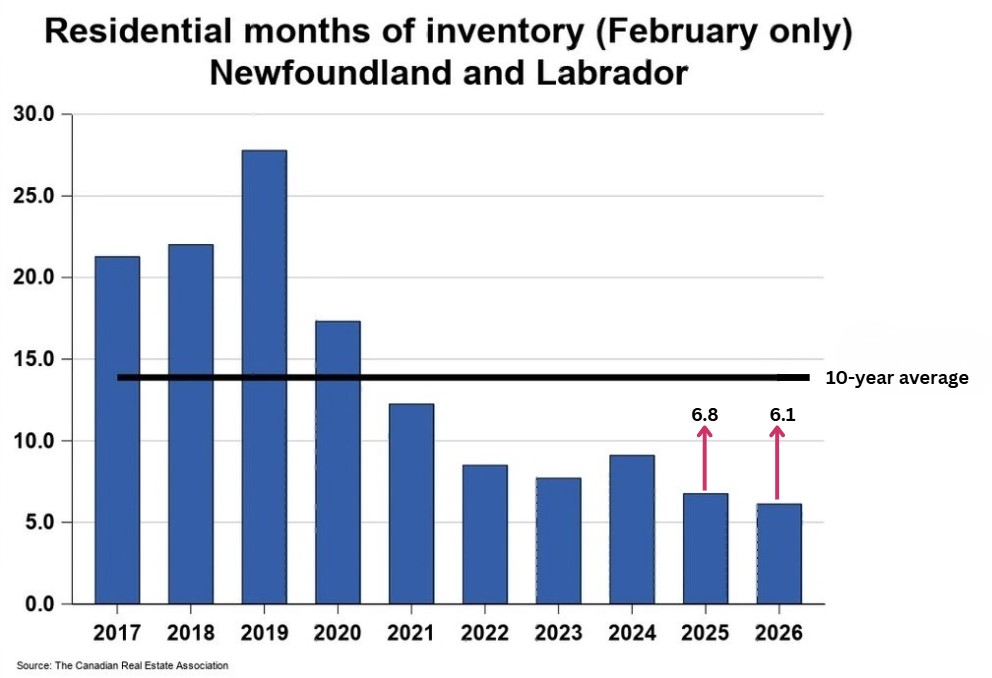
There were 6.1 months of inventory at the end of February 2026, down from the 6.8 months recorded at the end of February 2025
The number of months of inventory is the number of months it would take to sell current inventories at the current rate of sales activity
Month-Over-Month Comparison For 2026
| Month | Sales | Average Price | New Listings | Number of Active Listings | Months of Inventory at Month End |
|---|---|---|---|---|---|
| January | 288 | $348,366 | 524 | 1688 | 5.8 |
| February | 272 | $332,983 | 449 | 1665 | 6.1 |
Understanding the MLS® Home Price Index (HPI)*
The MLS® Home Price Index (HPI) is one of the most reliable tools for tracking changes in home prices over time. Unlike average or median sale prices, which can fluctuate sharply from month to month, the HPI provides a clearer picture of true market trends
It tracks price changes for major housing types, including single-family homes, townhouses, and apartments. Prices are measured relative to a base period, making it easy to see how values have risen or fallen over time.
Average and median prices can be misleading because they are heavily influenced by the types of homes sold in a given month.
For example, a rise in luxury home sales can push the average price higher even if typical home values remain unchanged. The MLS® HPI avoids this issue by comparing similar homes over time — an approach often described as an “apples-to-apples” comparison.
Rather than focusing solely on sale prices, the HPI measures how buyers value individual home features.
These include features such as the number of rooms and bathrooms, square footage, lot size, age of the property, and construction details like flooring, roofing, and foundation type. Because these characteristics change gradually, the index produces more stable and meaningful results.
By: Gar Mouland, CPA
Canadian Commercial Network (CCN)
Broker/Owner/Operator
Outlier NL Realty
(709) 728-2212
https://www.outliernlrealty.com/